
Interactive Visualization of Optimization Algorithms in Deep Learning
Optimization on non convex functions in high dimensional spaces, like those encountered in deep learning, can be hard to visualize. However, we can learn a lot from visualizing optimization paths on simple 2d non convex functions.
Click anywhere on the function contour to start a minimization.
You can toggle the different algorithms by clicking the circles in the lower bar. The code is available here.
Observations
The above function is given by
\[f(x, y) = x^2 + y^2 - a e^{-\frac{(x - 1)^2 + y^2}{c}} - b e^{-\frac{(x + 1)^2 + y^2}{d}}\]It is basically a quadratic “bowl” with two gaussians creating minima at (1, 0) and (-1, 0) respectively. The size of these minima is controlled by the \(a\) and \(b\) parameters.
Different minima
Starting from the same point, different algorithms will converge to different minima. Often, SGD and SGD with momentum will converge to the poorer minimum (the one on the right) while RMSProp and Adam will converge to the global minimum. For this particular function, Adam is the algorithm that converges to the global minimum from the most initializations.
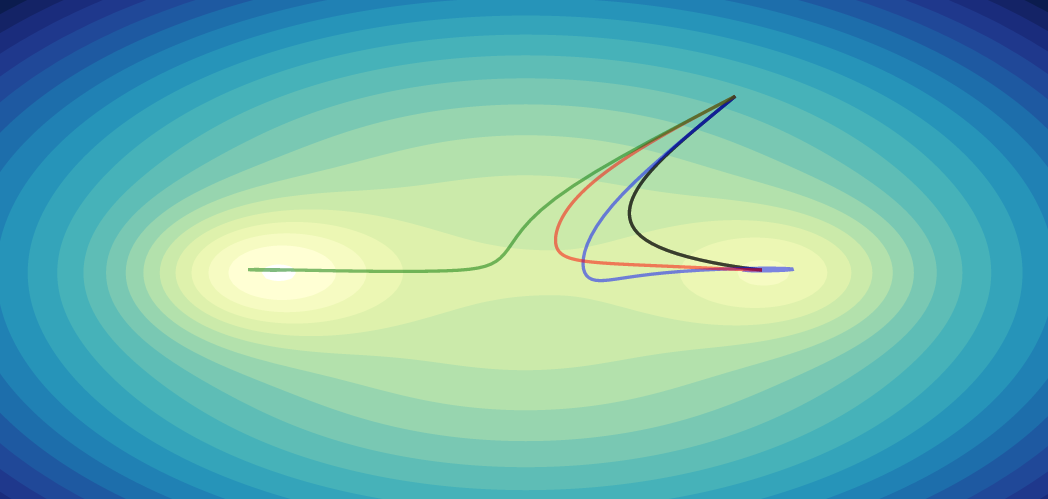
Only Adam (in green) converges to the global minimum.
The effects of momentum
Augmenting SGD with momentum has many advantages and often works better than the other standard algorithms for an appropriately chosen learning rate (check out this paper for more details). However, with the wrong learning rate, SGD with momentum can overshoot minima and this often leads to a spiraling pattern around the minimum.
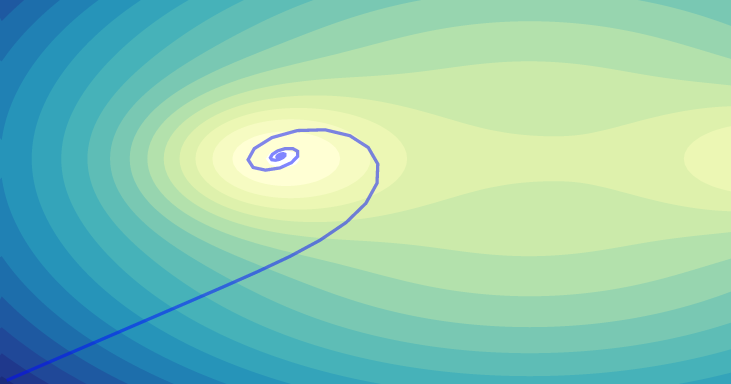
SGD with momentum spiraling towards the minimum.
Standard SGD does not get you far
SGD without momentum consistently performs the worst. The learning rate for SGD on the visualization is set to be artificially high (an order of magnitude higher than the other algorithms) in order for the optimization to converge in a reasonable amount of time.
Classic optimization test functions
There are many famous test functions for optimization which are useful for testing convergence, precision, robustness and performance of optimization algorithms. They also exhibit interesting behaviour which does not appear in the above function.
Rastrigin
The visualization for this function can be found here
A Rastrigin function is a quadratic bowl overlayed with a grid of sine bumps creating a large number of local minima.
SGD with momentum reaches the global optimum while all other algorithms get stuck in the same local minimum.
In this example, SGD with momentum outperforms all other algorithms using the default parameter settings. The speed built up from the momentum allows it to power through the sine bumps and converge to the global minimum when other algorithms don’t. Of course, this would not necessarily be the case if the sine bumps had been scaled or spaced differently. Indeed, on the first function in this post, Adam performed the best while SGD with momentum performs the best on the Rastrigin function. This shows that there is no single algorithm that will perform the best on all functions, even in simple 2D cases.
Rosenbrock
The visualization for this function can be found here
The Rosenbrock function has a single global minimum inside a parabolic shaped valley. Most algorithms rapidly converge to this valley, but it is typically difficult to converge to the global minimum within this valley.
All algorithms find the global minimum but through very different paths
While all algorithms converge to the optimum, the adaptive and non adaptive optimization algorithms approach the minimum through different paths. In higher dimensional problems, like in deep learning, different optimization algorithms will likely explore very different areas of parameter space.
Conclusion
Optimization algorithms can exhibit interesting behaviour, even on simple 2d functions. Of course, there are also many phenomena which we cannot hope to visualize on simple 2d problems. Understanding and visualizing optimization in deep learning in general is an active area of research. New optimization algorithms, like Eve or YellowFin, are also being developed. It would be interesting to modify the above code to visualize these more recent algorithms, although it is unclear whether they would differ significantly from momentum SGD on these toy problems.